Fathom Dynamic Data™ Software
With Fathom, students use data to deepen their understanding of mathematics, statistics, science, and social science. This easy-to-use software bridges the gap between concrete and abstract mathematical and statistical concepts by letting students see and manipulate data in a clear graphic form.
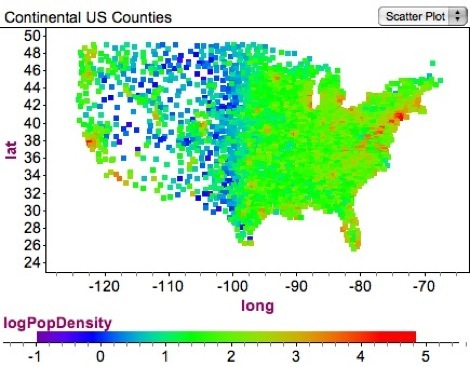
Students can access data sets and create many types of graphs, including bar charts, scatter plots, function plots, and histograms. Fathom gives students in eighth grade through college the power—and motivation—to gather, explore, and graphically analyze data in depth, and to understand concepts in mathematics and statistics as never before.
Fathom gives students the tools to:
-
•Plot values and functions on top of data and vary them dynamically with sliders
-
•Build simulations that illuminate concepts from probability and statistics
-
•Perform standard statistical analyses appropriate for introductory statistics and including multiple linear regression
-
•Set up populations and sample from them repeatedly, getting a feel for the sampling process and creating sampling distributions of any statistic whatsoever—no programming knowledge required!
Find out more at www.keypress.com/fathom!